So, let’s chat about something we often hear in statistics: the variance of the sample mean. Sounds a bit dry, right? But hang on! It’s super interesting once you get into it.
Este blog ofrece contenido únicamente con fines informativos, educativos y de reflexión. La información publicada no constituye consejo médico, psicológico ni psiquiátrico, y no sustituye la evaluación, el diagnóstico, el tratamiento ni la orientación individual de un profesional debidamente acreditado. Si crees que puedes estar atravesando un problema psicológico o de salud, consulta cuanto antes con un profesional certificado antes de tomar cualquier decisión importante sobre tu bienestar. No te automediques ni inicies, suspendas o modifiques medicamentos, terapias o tratamientos por tu cuenta. Aunque intentamos que la información sea útil y precisa, no garantizamos que esté completa, actualizada o que sea adecuada. El uso de este contenido es bajo tu propia responsabilidad y su lectura no crea una relación profesional, clínica ni terapéutica con el autor o con este sitio web.
You know that feeling when you try to guess how many jellybeans are in a jar? Sometimes you nail it; other times, not so much. That’s a bit like what this variance stuff is about!
The way we figure out those little differences helps us understand how reliable our guesses really are. Pretty cool, huh?
And guess what? This concept pops up all over—like in polls, experiments, and even in your favorite sports stats. So stick around! We’re breaking it down and having some fun along the way.
Understanding the Use of Sample Variance in Statistical Analysis and Its Implications for Data Interpretation
Sure, let’s jump right into sample variance and what it actually means for interpreting data. When you’re analyzing a group of numbers – like scores in a game or survey results – you might wonder how spread out those numbers are. That’s where variance comes in!
Sample Variance is basically a way to see how much the data values differ from the average (mean). You calculate it by taking the differences between each value and the mean, squaring them, adding those squares up, and finally dividing by the number of values minus one. Sounds complicated? Well, here’s a simpler version:
- First, get your average score or mean.
- Then, find out how far each score is from that mean.
- Square those differences (to make sure they’re all positive).
- Add up all those squared differences.
- Divide that total by one less than your sample size.
So if you had game scores of 80, 85, and 90, you’d find the mean is 85. The differences would be -5, 0, and +5 respectively. After squaring them (25 for -5 and +25 for +5), you add ’em up to get 50. Divide that by two (because there are three scores minus one), giving you a sample variance of 25.
You know what? Sample variance is super useful when you’re comparing different groups. Imagine two basketball teams; Team A has scores like [70, 75, 80] while Team B has [60, 90, and 95]. Even if Team A has higher averages overall, Team B’s scores vary widely!
Why does this matter? Well, if you’re trying to assess performance or predict outcomes based on previous data – say picking a team to bet on or just understanding your friends’ game habits – recognizing those variances can guide your decisions.
Now let’s talk about the implications for data interpretation. Variance can help you understand risk too! A high variance might indicate unpredictable performance – think rollercoaster game scores! If someone consistently hits high scores but also tanks sometimes… that makes it hard to rely on them consistently.
Also remember: not seeing all data can skew your impressions. If you just look at averages without considering variances—it’s like judging a book by its cover! You might miss out on important patterns hiding beneath those surface numbers.
The bottom line: Understanding sample variance and how it plays into your analysis can turn raw data into valuable insights. Whether you’re looking at sports stats or work assessments—keeping an eye on both averages AND variances gives you better context about what those numbers really mean.
Just keep in mind — while this info is super helpful in interpreting statistical data better, it’s always wise to consult with professionals when making decisions based on complex analyses!
Understanding Variance: A Step-by-Step Calculation for the Data Set 2, 4, 5, 6, 8, 17
Alright, so let’s talk about **variance**. Variance is one of those stats you hear about but might not fully grasp. Basically, it tells you how spread out the numbers in a data set are. If you’ve got a set of numbers that are all really close together, the variance is low. If they’re spread out, like my friends’ opinions on pineapple on pizza—that’s gonna be high!
So we’re gonna take a sample data set: 2, 4, 5, 6, 8, 17. Ready? Let’s break it down and calculate the variance step-by-step.
First things first: find the mean (that’s just the average). You add up all the numbers and then divide by how many there are.
- Add them up: 2 + 4 + 5 + 6 + 8 + 17 = 42
- Count how many there are: 6 numbers
- The mean is: 42 ÷ 6 = 7
Now you’ve got your mean! Next step? Get each number’s difference from that mean. This means subtracting the mean from each number in your data set.
- 2 – 7 = -5
- 4 – 7 = -3
- 5 – 7 = -2
- 6 – 7 = -1
- 8 – 7 = +1
- 17 – 7 = +10
Once you have those differences, square each of them. Why square them? Because this way you keep everything positive and emphasize larger differences.
- (-5)² = 25
- (-3)² = 9
- (-2)² = 4
- (-1)² = 1
- (+1)² = 1
- (+10)² = 100
Next up is adding all those squared values together.
Total of squared differences:
- Add them up:
25 + 9 + 4 + 1 + 1 +100 =BOLD 140 .) - Sampling Variability: When you take random samples, their means can differ just because of chance.
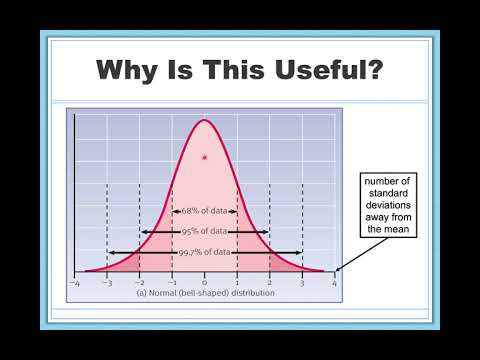
- Standard Error: This is related to variance; it is how much we expect the sample mean to fluctuate from the true population mean.
- Central Limit Theorem: It states that as you take larger samples, your sample means will form a normal distribution—even if the population isn’t normal.
- Research Applications: Understanding this variance helps psychologists interpret data correctly. For example, if you’re studying stress levels pre- and post-exams in students, knowing how these scores vary gives deeper insights.
Now here’s where things get interesting! Since we’re dealing with a sample (not a whole population), we’ll divide by n-1 instead of n to get our final variance. In our case:
N (number of values): 6 , therefore N -1 equals5.
So we’ll divide that total by **5**:
SAMPLE VARIANCE:
= Total of squared differences / (n – 1)
=140/5=28.
And there you have it! The variance for our sample data set is **28**.
What does this even mean? Well, it shows us how much these numbers differ from the average number in our sample—basically telling us how spread out or clustered they are around that average value!
And remember folks: if you’re using this info for serious stuff—like big decisions or academic work—it’s always best to consult a trusted expert or professional who can guide you through it properly!
Understanding the Variance of Sample Mean: Key Concepts and Research Applications in Quantitative Psychology
Alright, let’s chat about the variance of sample means and why it matters in quantitative psychology. Grab a snack, and let’s break it down in a way that really clicks.
First things first, what is this variance of sample means all about? Well, imagine you’re playing a game like basketball. You practice a lot, but some days you’re just off. The average score you get—your mean—can change depending on those off days or good days. That’s basically what happens with sample means too; they can vary based on different samples taken from the same population.
The variance of sample means specifically tells us how much those averages differ from one another. If you take multiple samples from the same group—like a bunch of students taking a test—you’ll notice that their average scores might not be exactly the same. Some groups might do really well, while others don’t perform as highly. This difference is what we refer to as variance!
Let’s look at some key points that make this concept clearer:
So here’s an emotional twist for you: Picture someone studying hard for finals but feeling completely stressed out by their expectations and performance anxiety. They take practice exams randomly throughout the semester. Some exams show great results while others are dismal due to nerves or fatigue. When we analyze these scores and look at their average (the mean), understanding variance helps us grasp what might be happening under pressure.
Now onto why this matters in real-world psychology research! Researchers often use these concepts when they’re looking at treatments or therapies across different populations. Maybe they want to see if a new therapy for anxiety works better than something traditional among college students versus high schoolers.
By analyzing the variance of sample means from each group, they can figure out which approach is more effective overall—and help develop better strategies down the line.
Ultimately, being aware of how sample means can vary helps psychologists avoid jumping to conclusions based on just one scenario or instance. It sets them up to have more robust findings that’ll actually help folks who need support!
So remember, if you ever come across research involving averages and their variation—know it’s not just numbers on paper but rather insights into human behavior! And wherever your journey takes you regarding mental health or psychology stuff—you got this!
When you hear the word “variance,” it might conjure up images of complex calculations and stuffy statistics textbooks, right? But hang on! Variance of the sample mean is really about understanding how much our sample averages wiggle around. I mean, think about it. If you were to take multiple samples from a population, would all of those averages look exactly the same? Spoiler alert: they won’t!
Imagine you’re baking cookies. You mix ingredients together, scoop them onto a tray, and pop them in the oven. Some cookies come out perfectly golden, while others are a little too crispy or undercooked. Similarly, when you take samples from a population—say people’s heights or test scores—not every sample will yield the same average.
So what’s variance doing in this scenario? It’s like measuring how spread out those cookie results are! The formula for variance looks intimidating at first glance—it involves finding the mean first and then taking the average of squared differences from that mean—but at its core, it’s just trying to give us insight into how much diversity there is among our sample means.
You can think of it as being an essential part of research and data analysis. For example, let’s say you gathered data about people’s favorite pizza toppings in your town. You take a few samples from different neighborhoods because people’s tastes vary widely (pineapple lovers vs pepperoni fans!). By calculating the variance of these sample means, you get a clearer picture on whether toppings preferences significantly differ across neighborhoods or if everyone’s pretty much on the same page.
And here’s where it gets interesting: high variance can signal that something is going on! Maybe there are cultural differences influencing topping choices—or maybe folks just really like trying unusual combinations! Low variance might suggest that pizza lovers have basically agreed on what makes the perfect slice.
But don’t forget—the key here is knowing your limits. A small sample size can lead to misleading conclusions. You wouldn’t want to judge all pizza lovers based solely on your friends’ opinions because who knows—they might just prefer boring cheese over everything else!
In summary, understanding variance helps us make sense of real-world situations where averages don’t tell the full story. So next time you bite into a cookie or take a slice of pizza with your buddies, remember: there’s more behind those averages than meets the eye!